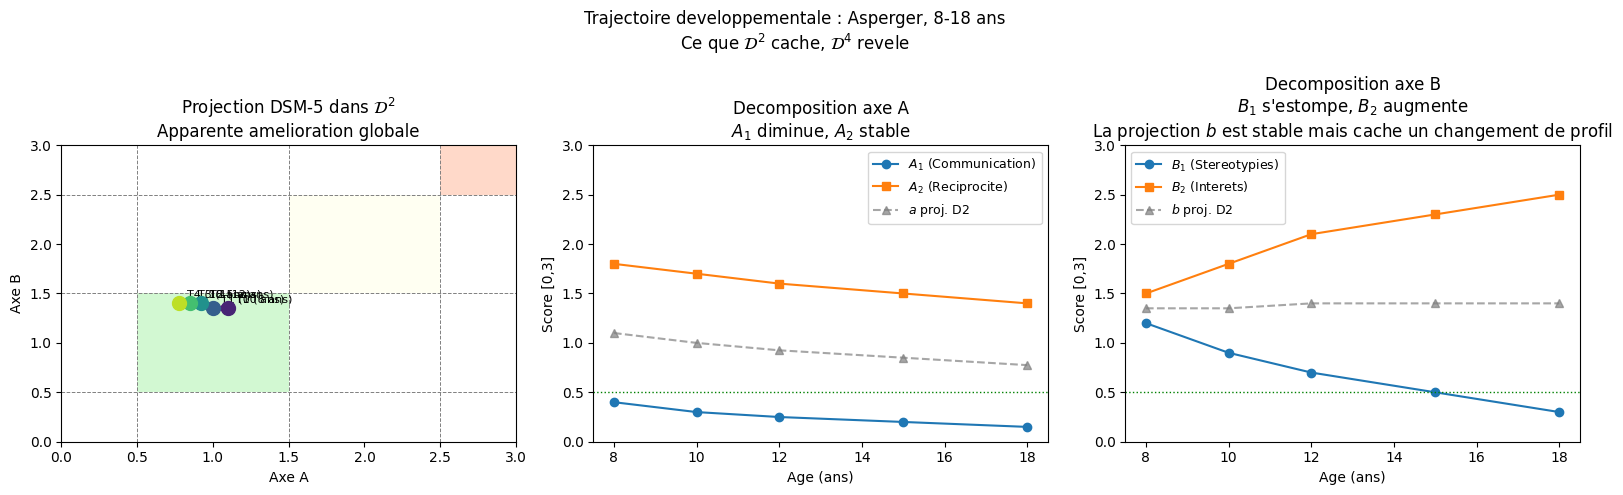
temps     = np.array([8, 10, 12, 15, 18])
labels_t  = [f'T{i} ({t} ans)' for i, t in enumerate(temps)]

trajectoire_d4 = np.array([
    [0.40, 1.8, 1.2, 1.5],
    [0.30, 1.7, 0.9, 1.8],
    [0.25, 1.6, 0.7, 2.1],
    [0.20, 1.5, 0.5, 2.3],
    [0.15, 1.4, 0.3, 2.5]])
trajectoire_d2 = projeter_d2(trajectoire_d4)

colors_t = plt.cm.viridis(np.linspace(0.1, 0.9, len(temps)))
fig, axes = plt.subplots(1, 3, figsize=(16, 5))

# Panneau 1 : trajectoire dans D2
ax1 = axes[0]
for vmin, vmax, col in [(0.5,1.5,'lightgreen'),(1.5,2.5,'lightyellow'),(2.5,3,'lightsalmon')]:
    ax1.add_patch(plt.Rectangle((vmin,vmin),vmax-vmin,vmax-vmin,facecolor=col,alpha=0.4))
for v in [0.5, 1.5, 2.5]:
    ax1.axhline(v, color='gray', lw=0.7, ls='--')
    ax1.axvline(v, color='gray', lw=0.7, ls='--')
ax1.plot(trajectoire_d2[:,0], trajectoire_d2[:,1], 'gray', lw=1.5, alpha=0.5)
for i in range(len(temps)):
    x, y = trajectoire_d2[i]
    ax1.scatter(x, y, s=100, color=colors_t[i], zorder=5)
    ax1.annotate(labels_t[i], (x,y), xytext=(6,4), textcoords='offset points', fontsize=8)
    if i > 0:
        ax1.annotate('', xy=trajectoire_d2[i], xytext=trajectoire_d2[i-1],
                     arrowprops=dict(arrowstyle='->', color='purple', lw=1.5))
ax1.set_xlim(0,3); ax1.set_ylim(0,3)
ax1.set_xlabel('Axe A'); ax1.set_ylabel('Axe B')
ax1.set_title('Projection DSM-5 dans $\mathcal{D}^2$\nApparente amelioration globale')

# Panneau 2 : decomposition axe A
ax2 = axes[1]
ax2.plot(temps, trajectoire_d4[:,0], marker='o', label='$A_1$ (Communication)')
ax2.plot(temps, trajectoire_d4[:,1], marker='s', label='$A_2$ (Reciprocite)')
ax2.plot(temps, trajectoire_d2[:,0], marker='^', ls='--', color='gray', alpha=0.7, label='$a$ proj. D2')
ax2.axhline(0.5, color='green', ls=':', lw=1)
ax2.set_xlabel('Age (ans)'); ax2.set_ylabel('Score [0,3]')
ax2.set_title('Decomposition axe A\n$A_1$ diminue, $A_2$ stable')
ax2.legend(fontsize=9); ax2.set_ylim(0, 3)

# Panneau 3 : decomposition axe B
ax3 = axes[2]
ax3.plot(temps, trajectoire_d4[:,2], marker='o', label='$B_1$ (Stereotypies)')
ax3.plot(temps, trajectoire_d4[:,3], marker='s', label='$B_2$ (Interets)')
ax3.plot(temps, trajectoire_d2[:,1], marker='^', ls='--', color='gray', alpha=0.7, label='$b$ proj. D2')
ax3.axhline(0.5, color='green', ls=':', lw=1)
ax3.set_xlabel('Age (ans)'); ax3.set_ylabel('Score [0,3]')
ax3.set_title('Decomposition axe B\n$B_1$ s\'estompe, $B_2$ augmente\nLa projection $b$ est stable mais cache un changement de profil')
ax3.legend(fontsize=9); ax3.set_ylim(0, 3)

plt.suptitle('Trajectoire developpementale : Asperger, 8-18 ans\n'
             'Ce que $\mathcal{D}^2$ cache, $\mathcal{D}^4$ revele', fontsize=12)
plt.tight_layout()
plt.show()